My races and lessons
My two Run Melbourne half marathons: from fading late to finishing strong
In 2025 I struggled late. In 2026 I finished strongly. The difference matters to me because that is what I want from my next marathon: a finish I can still run with purpose.
At a glance
All 41 available full laps support a closer look at the two finishes. The Race Replay compares recorded segments; the source notes explain the different GPS distance coverage.
The difference I remember
I started running in late 2024 with the goal of completing a half marathon. Run Melbourne gave me two experiences a year apart. In July 2025, the later kilometres were a struggle. In July 2026, I had more to give near the finish.
A faster overall run is encouraging, but the way I finished is the part I want to understand and repeat. These split tables let me put that recollection beside the numbers. They also show where a simple comparison needs care.
What the activity records show
On a small screen, swipe the table to see all columns.
| Recorded detail | 13 July 2025 | 19 July 2026 |
|---|---|---|
| Activity time | 2:05:17 | 1:50:57 |
| Recorded distance | 20.79 km | 21.27 km |
| Displayed average pace | 6:02/km | 5:13/km |
| Average heart rate | 171 bpm | 164 bpm |
| Recorded elevation gain | 152 m | 155 m |
My 2025 activity note says “Lost 300m in Docklands..”. The two GPS recordings therefore do not provide exactly matched distance markers. I use the full-kilometre lap pattern to describe the runs; I do not reconstruct the missing distance or derive an exact race-half comparison.
The similar elevation totals do not establish identical terrain at each recorded kilometre. Weather, sensor accuracy and other race-day differences also remain outside this comparison.
The pace pattern behind the experience
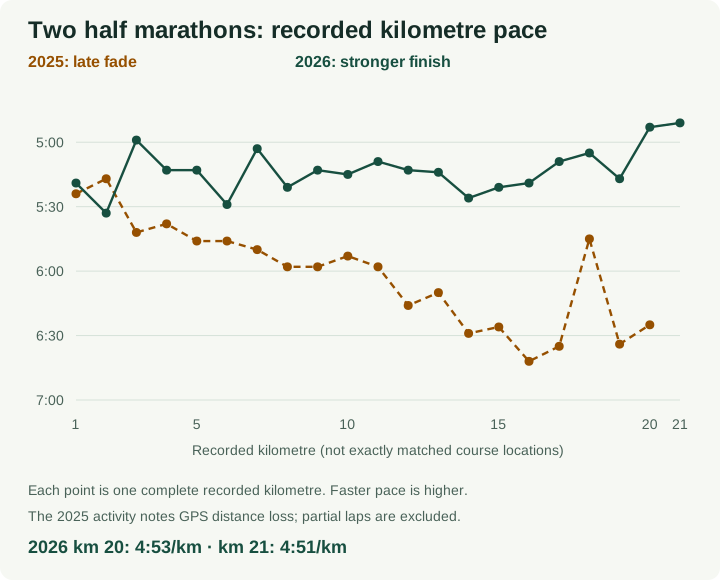
The 2025 line generally moves towards slower paces as the run progresses. The 2026 line is steadier through much of the run before the final acceleration. Individual hills and GPS behaviour can affect a lap, so the broader pattern is more useful than one unusually quick or slow kilometre.
Race Replay / 41 recorded full laps
Where did the pace change?
The first-to-last five-kilometre blocks give a useful overview. This analysis uses every available full lap and adds a second check: compare the first ten recorded laps with the next ten within each race.
| Activity | Laps 1–10 average | Laps 11–20 average | Later minus earlier pace | 20-lap sum |
|---|---|---|---|---|
| 2025 | 5:43.2/km | 6:20.0/km | +36.8 sec/km | 2:00:32 |
| 2026 | 5:15.8/km | 5:12.6/km | -3.2 sec/km | 1:44:44 |
The new comparison: the later ten-lap segment took 6:08 longer than the first in 2025. In 2026 it took 0:32 less. Those totals come from the displayed lap paces: 57:12 then 1:03:20 in 2025; 52:38 then 52:06 in 2026. The 21st full 2026 lap, at 4:51/km, sits outside this common 20-lap comparison and remains available in the replay.
These are watch-defined segments, not official 10 km checkpoints or exact race halves. The 2025 GPS loss prevents matching course positions across years. Rounded partial-lap labels are excluded from sums; the displayed activity time is kept separate.
The comparison and complete recorded lap tables remain readable without the replay.
Dots: recorded lap paces. Dashed line: chosen hypothetical pace. The larger dot marks the selected recorded lap.
What this changes in the interpretation
The difference extends beyond one finishing sprint: the 2026 record held a similar average pace across two ten-lap segments, while the 2025 record slowed over the later segment. That is a more specific description of the finish I want to repeat. It does not identify whether fitness, pacing, course, conditions or fueling produced the change.
For my next comparison I would retain the original activity file and official checkpoint times, then describe recorded and official distance separately. I would also log the intended effort and what was actually consumed. Those records would answer questions these screenshots leave open.
Reproduce this: sum rounded lap paces 1–10 and 11–20 separately, divide each by ten for pace, then subtract the segment totals. Replay sums stop at the selected full lap. Download all source laps (JSON) · Read the complete lap tables · Source and transcription notes.
2025: the slowdown developed before the finish
My first two recorded kilometres were 5:24 and 5:17/km. The first five averaged 5:33.4/km. By kilometres 11–15, the average was 6:15.8/km, and kilometres 16–20 averaged 6:24.2/km. That is consistent with my memory of struggling late.
Kilometre 18 stands out at 5:45/km between slower laps. It also shows a net descent of 27 metres. I would not treat that isolated faster lap as proof that the earlier difficulty had passed.
Heart rate remained high in the later recorded laps while pace slowed. That describes the pattern; it does not diagnose its cause. The record alone cannot separate target choice, fitness, conditions and fueling.
2026: more capacity in the later kilometres
In 2026, the first three five-kilometre blocks averaged 5:15.4, 5:16.2 and 5:16.6/km. Kilometres 16–20 averaged 5:08.6/km. The final five full recorded kilometres, 17–21, averaged 5:03/km.
The final two full kilometres were 4:53 and 4:51/km. Their recorded elevation changes were −5 m and +2 m. My average heart rate for those laps rose from 167 to 174 bpm. Together with how I remember the finish, those figures show that I was able to increase effort late.
I call this a strong finish. A few faster final kilometres do not establish the exact first-half and second-half times of the race. They also do not prove that starting faster would have produced a better result.
Compare the larger sections
On a small screen, swipe the table to see all columns.
| Recorded kilometres | 2025 average | 2026 average |
|---|---|---|
| 1–5 | 5:33.4/km | 5:15.4/km |
| 6–10 | 5:53.0/km | 5:16.2/km |
| 11–15 | 6:15.8/km | 5:16.6/km |
| 16–20 | 6:24.2/km | 5:08.6/km |
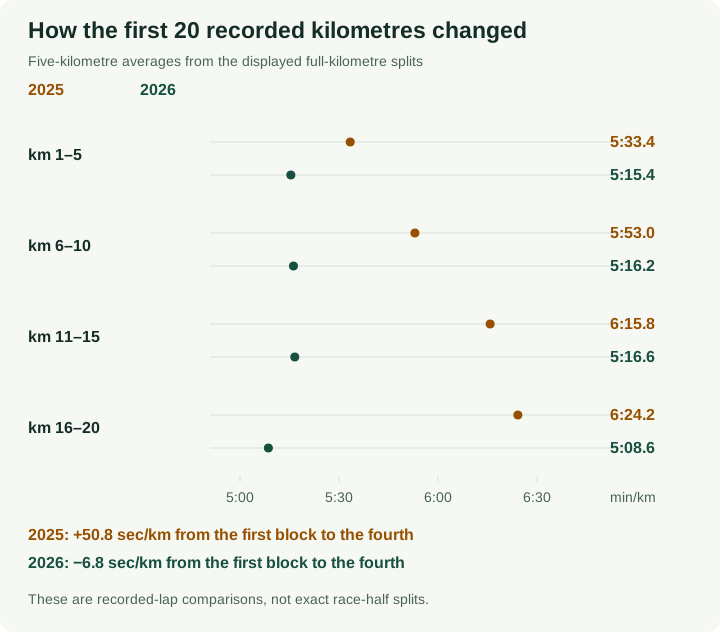
From the first block to the fourth, the recorded pace slowed by 50.8 seconds per kilometre in 2025. In 2026 it became 6.8 seconds per kilometre faster. This is the clearest numerical contrast behind my two recollections.
What I take from the heart-rate difference
The activity summaries show a lower average heart rate in 2026 despite the faster recorded pace. That is an observation worth retaining, but it is not a measurement of how much fitter I became. I do not have a controlled match of conditions and sensor performance here.
The useful personal question is whether pace, perceived effort and the ability to finish well tell a consistent story. The heart-rate and effort guide explains how I use those signals without treating one number as the answer.
What I want to carry into my next marathon
My later Sydney Marathon showed the limit of carrying half-marathon confidence into a longer race. I went in with the 1:50:57 half behind me and a sub-four goal, but I did not sustain the race I wanted. I began repeated walking around 31–32 km.
The goal for my next marathon includes finishing strongly, not only arriving at a particular time. For me, that means choosing a target from repeatable training, keeping the opening controlled and rehearsing a fueling plan I can still follow late. Those are priorities for the next build, not a claim that I have already solved the marathon.
- Use the half-to-marathon guide to understand a prediction’s assumptions.
- Review the readiness questions alongside the whole training block.
- Compare negative-split arithmetic with the more practical aim of finishing in control.
A strong half marathon is evidence of that half marathon. The next distance still needs its own preparation.
My post-Sydney rebuild intentions explain how I want to work towards that finish. They are a proposed approach, not evidence that the next marathon will repeat the half-marathon result.
The complete recorded kilometre tables
On a small screen, swipe the table to see all columns.
| Recorded km | 2025 pace | 2025 HR | 2026 pace | 2026 HR |
|---|---|---|---|---|
| 1 | 5:24 | 162 | 5:19 | 158 |
| 2 | 5:17 | 166 | 5:33 | 162 |
| 3 | 5:42 | 169 | 4:59 | 162 |
| 4 | 5:38 | 167 | 5:13 | 161 |
| 5 | 5:46 | 170 | 5:13 | 161 |
| 6 | 5:46 | 171 | 5:29 | 162 |
| 7 | 5:50 | 170 | 5:03 | 164 |
| 8 | 5:58 | 170 | 5:21 | 163 |
| 9 | 5:58 | 171 | 5:13 | 164 |
| 10 | 5:53 | 172 | 5:15 | 164 |
| 11 | 5:58 | 173 | 5:09 | 165 |
| 12 | 6:16 | 171 | 5:13 | 164 |
| 13 | 6:10 | 174 | 5:14 | 164 |
| 14 | 6:29 | 173 | 5:26 | 164 |
| 15 | 6:26 | 171 | 5:21 | 163 |
| 16 | 6:42 | 172 | 5:19 | 165 |
| 17 | 6:35 | 174 | 5:09 | 166 |
| 18 | 5:45 | 173 | 5:05 | 166 |
| 19 | 6:34 | 173 | 5:17 | 166 |
| 20 | 6:25 | 176 | 4:53 | 167 |
| 21 | — | — | 4:51 | 174 |
The 2025 screenshot ends with a partial lap labelled 0.7 km at 5:58/km and 178 bpm. The 2026 partial lap is labelled 0.2 km at 4:48/km and 174 bpm. Those displayed distances are rounded; neither partial lap is used in the five-kilometre calculations.
Sources and calculation method
This account combines my recollection with my Strava activity summaries and kilometre split tables. Paces and heart rates are transcribed as displayed. Block averages are calculated from full-kilometre lap paces, retaining the decimal before display. Download the transcribed data and calculation notes.
The comparison does not establish which training, fueling or equipment change caused the improvement. No missing distance is filled in, no race-half split is inferred, and no activity badge is treated as a direct comparison between these races. Editorial policy · Corrections.